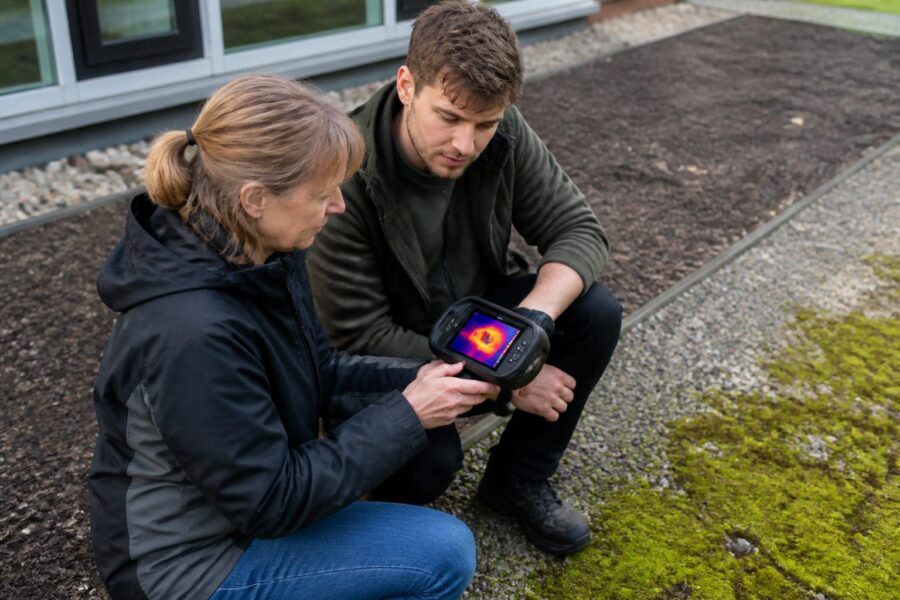
A moss thermal camera study around your building can be as simple as a weekend project, or as fussy as a field lab if you want it to be. The payoff is that you stop guessing where heat builds up and start measuring it in a way you can repeat.
I like this kind of test because moss sits at the intersection of biology and building materials, and it reacts fast to sun and drying. If you grow moss on walls, roofs, pavers, or planters, surface temperature is one of the quickest clues that something is going wrong.
You do not need a professional thermal imager to get useful comparisons, but you do need discipline. A cheap phone attachment, a borrowed camera, or even an infrared thermometer can produce patterns that change how you place and care for moss.
What thermal images can (and can’t) tell you
Thermal cameras measure infrared radiation and convert it into a temperature estimate for each pixel. That estimate depends on settings, surface emissivity, and what the camera is really seeing, which is often a mix of surface and reflected heat.
What thermal images do well is show relative differences across surfaces at the same moment. If moss reads cooler than gravel at noon in the same frame, that is a real clue even if the exact numbers are off by a few degrees.
What they do poorly is prove cause by themselves. A cool patch might be wet, shaded, wind-cooled, or simply a high-emissivity surface that reads more honestly than shiny stone.
Use thermal photos to ask better questions, not to declare victory for one surface type. The best moss thermal camera study pairs images with notes on moisture, sun angle, and recent rain.
If you only own an infrared thermometer, you can still run the same logic with spot checks. You lose the pretty picture, but you gain a habit of measuring the same points in the same way.

Picking comparison surfaces for a fair test
Start by choosing surfaces that sit close together so they share the same sun, wind, and air temperature. A mossy strip beside bare concrete and a gravel bed is better than comparing moss in shade to asphalt in full sun.
Try to keep slope and orientation similar, because a south-facing wall in July behaves like a space heater. If you can only compare different orientations, treat that as a separate experiment and label it clearly.
For moss, pick a patch that is established and not half dead from last week’s drought. For gravel, pick a section with similar stone color and size, because dark basalt and pale pea gravel will not behave the same.
Bare surfaces should be truly bare, not dusted with algae or shaded by a railing at certain hours. In urban spots, tiny shade changes from street trees and HVAC units can swing your readings more than you expect.
If you want the comparison to matter for cultivation, include the exact substrate you plan to use for moss. A brick wall, a concrete cap, and a glazed tile all handle heat and moisture differently, and the moss will tell on you later.
Timing matters: morning, noon, evening, and after rain
Timing is where most DIY thermal work falls apart, because people take one dramatic noon image and call it a result. You need a small schedule so your moss thermal camera study captures heating and cooling, not just peak heat.
Use the same time windows for each surface, and do it on at least two different days if you can. One day after rain is especially useful because it separates moisture effects from pure color and texture effects.
| Time window | What to capture | Why it matters for moss |
|---|---|---|
| Early morning (sun just up) | Overnight cooling baseline | Shows which surfaces shed heat and which stay warm |
| Solar noon (highest sun) | Peak heating and glare risks | Tests desiccation stress and heat load on moss |
| Late afternoon (2 to 3 hours before sunset) | Stored heat in stone and concrete | Reveals heat soak that can dry moss after shade returns |
| Evening (after surfaces lose direct sun) | Cooling rate and lingering hot spots | Hints at night-time drying and survival on walls |
| After rain (within 1 to 6 hours) | Wet surface behavior | Separates evaporative cooling from material differences |
Setting up repeatable photo angles and distances
Repeatability is the difference between a neat picture and a study you can trust. Pick a standing spot, mark it with chalk or tape, and shoot from the same height each time.
Keep the camera angle as close to perpendicular as you can, especially for smooth stone and painted metal. Oblique angles increase reflection problems and can make a surface look hotter or cooler for the wrong reason.
Use a wide shot for context and a tighter shot for measurement, then keep both consistent across sessions. If your camera software allows it, lock the temperature scale so colors do not auto-stretch between images.
If you are using an infrared thermometer, build a simple point map with numbered targets. A Sharpie dot on concrete or a small piece of matte tape can keep your aim consistent.
Do not stand so close that your own body heat or shadow changes the surface, especially on small moss patches. I have watched a tiny wall colony warm up just because I hovered in front of it taking photos.
Recording weather conditions that affect readings
Thermal readings are weather data wearing a costume, so write down the weather like you mean it. Air temperature, cloud cover, and wind speed can flip your results even when the surfaces are identical.
Humidity matters because it changes how fast moisture evaporates from moss and soil. A hot dry day can make moss look warmer simply because it is already dry and cannot cool itself through evaporation.
- Air temperature (from a shaded thermometer)
- Cloud cover (clear, scattered, overcast)
- Wind speed estimate (calm, light, breezy)
- Time since last rain or irrigation
- Surface wetness note (dry, damp, visibly wet)
- Sun exposure at the moment (full sun, partial, shade)
- Any nearby heat source (vent, condenser, exhaust)
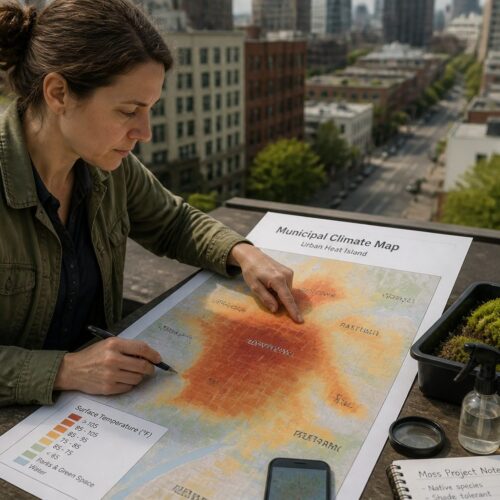
Turning images into simple heat maps you can understand
You do not need GIS software to make surface heat mapping useful for a building-scale project. You need a consistent color scale, a few labeled points, and a way to compare sessions side by side.
Export images with the temperature legend visible, and store them in folders by date and time window. If your camera app hides raw numbers, pair each image with a few spot measurements from an infrared thermometer.
Create a simple base photo of the area in normal light, then mark your measurement zones with letters. When you overlay thermal images mentally or in a basic editor, those letters keep you honest.
For each zone, record minimum, maximum, and a typical value you pick consistently, like the median pixel or a thermometer spot. The goal is not statistical perfection, it is a repeatable summary that matches what your eye sees.
When you present results, show at least one set where moss, gravel, and bare surfaces appear in the same frame. That single-frame comparison cuts through a lot of confusion about changing weather between shots.
Explaining differences: color, moisture, and texture
Moss often reads cooler in sun because it can hold water in leaves and capillary spaces, then shed heat through evaporation. When it dries out, that advantage can shrink fast, and the thermal image will show it.
Color is blunt but real, because dark gravel absorbs more solar energy than pale stone. If you compare green moss to black lava rock, your results will mix biology with basic physics.
Texture changes boundary layers, which is a fancy way of saying rough surfaces trap tiny pockets of air and change how wind removes heat. Gravel can look cooler or warmer depending on stone size, packing, and how much air circulates between pieces.
Moisture in bare concrete or brick matters too, because porous materials can store water and cool as it evaporates. A wall that looks dry can still have a damp core after rain, and your thermal camera might catch that as a cooler region.
Shade patterns are the sneaky factor that people blame on moss when it is really geometry. A handrail shadow that moves 18 inches across a wall can create a cool stripe that looks like a moss effect if you do not document it.
Avoiding common errors: reflections and emissivity issues
Reflections are the biggest trap, because thermal cameras can see a reflected sky or a reflected hot wall and call it surface temperature. Smooth stone, glazed tile, painted metal, and glass are the usual offenders.
Emissivity is the second trap, because the camera assumes a value that may not match your material. Moss and matte soil usually behave like high-emissivity surfaces, while shiny materials often read wrong unless you adjust settings.
The easiest DIY fix is to place a small patch of matte electrical tape on each surface and measure that spot consistently. If the tape reads very different from the surrounding surface, you know emissivity or reflection is messing with you.
Avoid shooting right after you bring the camera from air conditioning into hot humid air, because condensation and sensor drift can mess up early images. Give the device a few minutes outside to stabilize.
If you use an infrared thermometer, read the manual and set emissivity if the model allows it. If it does not, treat the numbers as comparisons within the same material, not as absolute truth across different materials.
Using results to improve placement and care of moss
The point of surface heat mapping is to decide where moss has a fair shot in your microclimate. If a wall section stays hot into the evening, you can expect more drying stress and slower recovery after sun.
Use your images to pick refuge zones, like north-facing corners, spots shaded by a parapet, or areas with morning sun and afternoon shade. Those are the places where moss often stays damp longer without constant watering.
If your moss patch reads hot and dry at noon, change irrigation timing before you change species. A short misting early morning can matter more than a heavy watering at night that never reaches the wall face.
Thermal patterns can also show where runoff hits, because wet streaks cool surfaces even when they look the same in visible light. If you want moss to spread, guiding a small amount of roof drip onto a rough substrate can help, but you need to watch for erosion and staining.
Do not ignore spots that are too cool and too wet, because those can turn into algae mats that smother moss. If your study shows a patch that never warms up, improve airflow or reduce constant drip instead of celebrating the cool colors.
Presenting findings clearly without overstating impact
People love a dramatic thermal image, so you need to write captions that keep your claims honest. Say “moss surface appeared cooler than adjacent gravel at 12:30 pm” instead of claiming the moss cooled the whole area.
Show the raw context photo beside the thermal image, because it explains shade and material boundaries instantly. When you hide the context, readers assume the colors mean more than they do.
Include your experimental design notes, even if they look boring, because that is what makes the work repeatable. A simple line about camera distance, angle, and whether you locked the temperature scale adds credibility fast.
If you used an infrared thermometer for spot checks, report the spots and the method, not just the best number. Cherry-picking the coolest moss reading is tempting, and it makes the whole project look like marketing.
When you discuss what it means for urban heat, keep the scale straight. A moss patch can change surface temperature and moisture behavior, but it will not fix a block of blacktop by itself.
Conclusion
A good moss thermal camera study is mostly about consistency, not expensive gear. Pick fair comparison surfaces, return at the same times, and write down weather so your images stay interpretable months later.
Thermal photos and an infrared thermometer work best when you treat them as tools for pattern finding, not as courtroom evidence. If you build repeatable surface heat mapping habits, you will place moss where it stays cooler and wetter, and you will waste less time nursing doomed patches.