

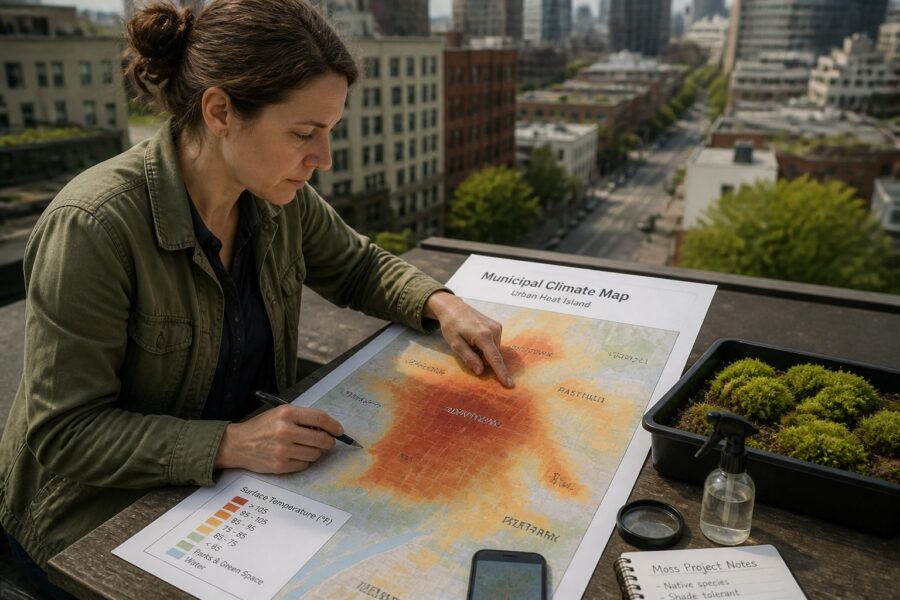
Understanding urban heat island data is a game-changer for anyone interested in urban moss cultivation. These maps reveal critical temperature differences across a city, showing exactly where heat concentrates. Using this information helps us strategically place moss projects where they can make the biggest difference.
Many city planners and environmental groups already use this data to address extreme heat, which means valuable resources are often publicly available. For urban moss cultivation, this data helps us target areas that need cooling the most. It also provides the scientific backing needed to demonstrate the impact of our greening efforts.
You can move beyond guesswork by learning to read and interpret these municipal climate maps. This knowledge allows you to identify precise locations that could benefit from moss-based cooling solutions. It shifts your urban greening efforts from general enthusiasm to targeted, impactful interventions.
Leveraging urban heat island data for moss projects means you are contributing to a healthier, cooler city. This approach makes your cultivation efforts smarter, more effective, and more aligned with broader urban sustainability goals. It is about making every patch of moss count in the fight against urban overheating.
What Urban Heat Island Maps Actually Show
Urban heat island maps are visual representations of temperature variations within a metropolitan area. They clearly show how built environments, like concrete and asphalt, absorb and re-emit more solar radiation than natural landscapes. This phenomenon creates “islands” of higher temperatures compared to surrounding rural areas.
These maps typically use color gradients to indicate temperature differences, with warmer colors representing hotter areas and cooler colors showing cooler spots. You will often see downtown cores, industrial zones, and large parking lots glowing red or orange. Green spaces, parks, and bodies of water usually appear in cooler shades of blue or green.
The maps illustrate how factors like building density, material choices, and lack of green infrastructure contribute directly to elevated temperatures. They highlight the stark contrast between areas with ample tree cover and those dominated by impervious surfaces. This visual evidence makes the case for greening projects very compelling.
Understanding an urban heat island map helps you see your city through a thermal lens, revealing hidden hot zones. It provides a foundational layer of information for any serious urban moss cultivation project. This knowledge helps you prioritize where your efforts will have the most significant cooling effect.
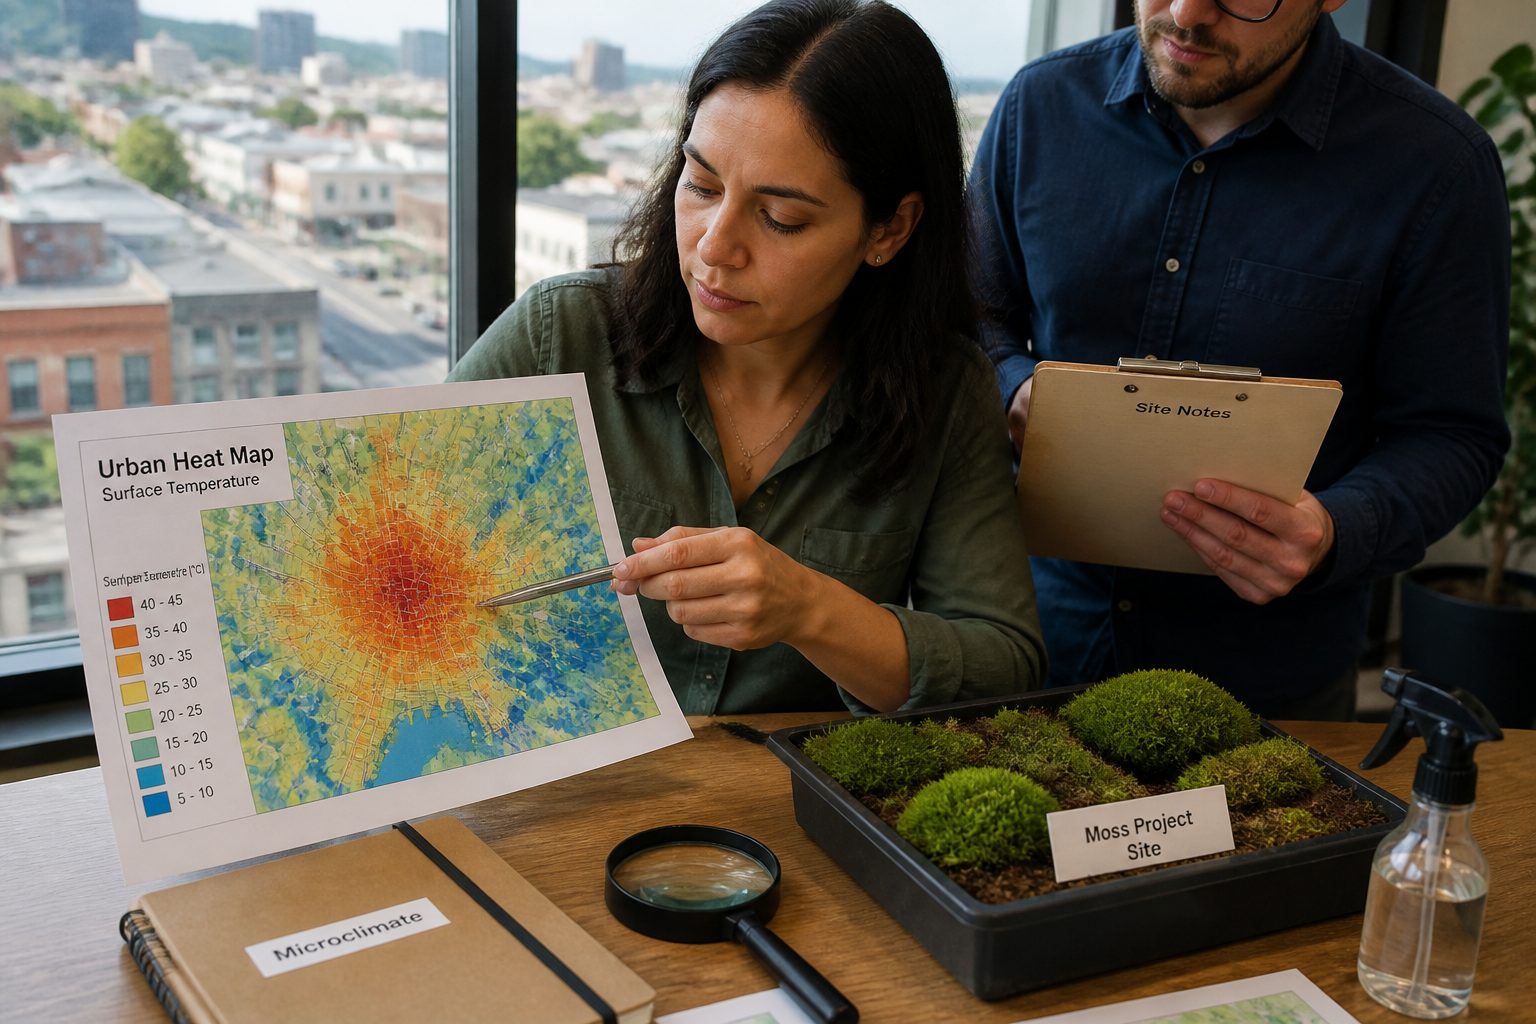
These maps are not just pretty pictures; they are powerful diagnostic tools. They help pinpoint specific blocks or neighborhoods that experience extreme heat stress. This level of detail is invaluable for anyone planning targeted environmental interventions.
For instance, a map might show a residential street with minimal tree cover as a significant hot spot. This immediately flags it as a prime candidate for cooling solutions, including extensive moss installations. The data points you directly to the problem areas.
These maps also offer insights into how different land uses affect local temperatures. Commercial districts with large, dark roofs often stand out as heat sinks. This suggests that green roof initiatives, including moss, could provide substantial relief in those areas.
Ultimately, a detailed urban heat island map provides the scientific basis for strategic urban heat island data moss projects. It allows you to visualize the problem and then develop solutions that directly address the most pressing thermal challenges. This targeted approach maximizes the impact of every effort.
Where to Find Free Municipal and Satellite Climate Data
Finding reliable urban heat island data is easier than you might think, with many free resources available from various levels of government and scientific institutions. These sources provide the foundational `city temperature data moss` projects need to succeed. You just need to know where to look for them.
Many cities and counties now publish their own climate resilience plans, which often include detailed `urban heat island map` data. These municipal reports are excellent starting points for local projects. Federal agencies also offer broader datasets that can be refined for specific urban areas.
| Source Type | Typical Provider | Data Focus |
|---|---|---|
| Local Government Portals | City/County Planning Departments | High-resolution surface temperature maps, local climate action plans |
| Federal Agencies | NOAA, EPA, NASA (e.g., Landsat) | Satellite-derived land surface temperature, historical climate trends |
| Academic Institutions | University climate labs, research consortia | Specialized `heat island microclimate` studies, predictive modeling |
| Non-Profit Organizations | Local environmental groups, climate alliances | Community-level assessments, advocacy reports, often maps |
Reading Surface Temperature vs. Air Temperature Data
When you look at urban heat island data, you will encounter two main types of temperature measurements: land surface temperature (LST) and air temperature. Understanding the difference between these is absolutely critical for effective urban moss cultivation. LST is what satellites measure, showing how hot surfaces actually get.
Air temperature, on the other hand, is what you typically hear on weather reports, measured a few feet above the ground at weather stations. While related, LST can be significantly higher than air temperature, especially on dark, impervious surfaces exposed to direct sunlight. This distinction is important for moss survival.
Moss directly interacts with the surface it grows on, meaning its immediate environment is primarily influenced by LST. High surface temperatures can quickly dry out moss and lead to heat stress, even if the ambient air feels relatively mild. This makes LST maps particularly valuable for site selection.
For `urban heat island data moss projects`, focusing on LST helps you identify surfaces that become extreme hot spots. These are the locations where moss can provide direct cooling benefits by reducing surface temperatures through evapotranspiration. It is about addressing the heat where it truly impacts the plant.
Air temperature data is still useful for understanding broader climatic conditions and overall `heat island microclimate` effects. It provides context for how the heat island impacts human comfort and energy consumption across neighborhoods. However, for bryophyte health, LST is the dominant factor.
Consider a dark asphalt rooftop on a sunny day; its LST might reach 150°F (65°C) while the air temperature is only 90°F (32°C). Moss cannot survive those surface conditions for long without adequate moisture and shade. This extreme difference highlights why you must prioritize LST data.
When evaluating potential sites, always cross-reference both types of data if available, but give more weight to LST for moss projects. Look for areas with persistently high LST that could benefit from a cooling surface layer. This ensures your efforts are directed where they matter most for the moss itself.
Ultimately, understanding the nuances between surface and air temperatures helps you make informed decisions about species selection and irrigation strategies. It allows you to design `urban heat island data moss projects` that are resilient to the specific thermal stresses of urban environments. This scientific precision leads to greater success.
Identifying High-Priority Sites for Moss Cooling Projects
Once you are comfortable interpreting urban heat island maps, the next step involves pinpointing the exact locations that would benefit most from moss cooling projects. This strategic site identification is crucial for maximizing the impact of your `urban heat island data moss projects`. You want to find places where moss can offer the greatest thermal relief.
Look for areas that consistently show up as the hottest spots on your `urban heat island map`, often represented by the deepest reds or oranges. These are typically large expanses of impervious surfaces like parking lots, flat rooftops, and wide sidewalks. These surfaces are prime candidates for intervention.
Prioritize locations that lack existing green infrastructure, such as trees or gardens, as these areas contribute most significantly to the heat island effect. A street with no canopy cover and extensive asphalt will always be hotter than one lined with mature trees. This visual assessment complements the temperature data.
Consider the scale of the hot spot; larger, more expansive areas will generally have a greater potential for cooling impact. Addressing a vast concrete plaza can yield more noticeable temperature reductions than a small, isolated patch of pavement. Think about where your efforts can create a substantial cool island.
Also, think about areas with high human traffic or vulnerable populations. Cooling a bus stop, a public square, or a pathway near senior housing provides direct benefits to people experiencing heat stress. Moss can contribute to both ecological health and public comfort.
Focus on surfaces that receive prolonged direct sunlight throughout the day. These are the surfaces that absorb the most solar radiation and reach the highest land surface temperatures. Moss can effectively intercept this radiation and reduce the heat absorbed by the underlying material.
Don’t overlook vertical surfaces. Walls, especially south or west-facing ones, can absorb and radiate significant heat into buildings and public spaces. Moss walls or green facades can provide insulation and evaporative cooling, addressing `heat island microclimate` effects at building level.
Finally, consider accessibility for installation and maintenance. While a remote, super-hot area might seem ideal, practical considerations like water access and safety are important. Choosing sites where you can realistically install and care for the moss increases your project’s long-term viability. This balanced approach ensures sustainable success for your `city temperature data moss` initiatives.
Cross-Referencing Heat Data With Moisture and Shade Maps
While urban heat island data pinpoints hot zones, moss thrives on more than just heat; it needs consistent moisture and adequate shade to truly flourish. Therefore, effective `urban heat island data moss projects` require cross-referencing temperature maps with additional environmental data. This holistic approach ensures long-term viability for your moss installations.
You can identify sites that are hot but also have existing shade from buildings, trees, or other structures. These areas offer a natural advantage, as the moss will be protected from the most intense direct sunlight. Incorporating shade information helps you select sites where moss can thrive without excessive intervention.
- Assess existing tree canopy coverage
- Identify building shadows during peak sun hours
- Locate areas with consistent humidity
- Map proximity to water sources for irrigation
- Evaluate natural drainage patterns
Using the Data to Set Realistic Expectations for Cooling
Deploying `urban heat island data moss projects` requires a clear understanding of what moss can realistically achieve in terms of cooling. While moss provides tangible benefits, it is not a magical solution that will drastically drop city-wide temperatures overnight. Setting realistic expectations helps manage project scope and stakeholder perceptions.
Moss primarily cools surfaces through evapotranspiration, a process where water held by the moss evaporates, taking heat with it. This effect is most pronounced on the surface itself and in the immediate `heat island microclimate` surrounding the moss. The cooling is localized rather than regional.
Expect to see significant reductions in land surface temperature (LST) on the moss-covered area compared to an uncovered surface. Studies often show LST differences of 10-30°F (5-17°C) depending on species, thickness, and environmental conditions. This localized cooling is where moss truly excels.
The impact on ambient air temperature will be more modest and generally confined to the immediate vicinity of large moss installations. A vast moss roof might slightly cool the air directly above it, but this effect dissipates quickly with distance and wind. Do not promise city-wide air temperature drops.
Your `city temperature data moss` analysis helps you target the most impactful areas, but it also reveals the scale of the problem. A single moss patch, while beneficial, won’t counteract a massive concrete heat sink. Multiple, interconnected projects are needed for broader effects.
The cooling effect of moss is also dependent on its health and moisture levels. Dry, stressed moss provides minimal cooling, which underscores the importance of proper irrigation and maintenance. Healthy, hydrated moss is essential for its thermal benefits.
Data from your `urban heat island map` can help you quantify the “before” state, giving you a baseline for measuring your project’s success. You can then demonstrate the specific surface temperature reductions achieved in your targeted hot spots. This provides concrete evidence of your contribution.
By understanding these limitations and benefits, you can communicate the value of your moss projects accurately and effectively. Focus on the localized cooling, stormwater management, and aesthetic benefits, rather than overselling large-scale atmospheric changes. This honesty builds credibility for your greening efforts.
Reporting Results: How to Document Your Project’s Contribution
Documenting the impact of your `urban heat island data moss projects` is essential for demonstrating success and securing future support. Clear, data-driven reporting validates your efforts and provides valuable insights for other urban greening initiatives. You need to show that your moss is making a measurable difference.
Start by establishing a baseline using the `urban heat island map` data and on-site temperature readings before installation. Record surface temperatures of the target area and a nearby control area without moss. This provides a crucial “before” picture against which to compare your results.
After installation, consistently monitor and record surface temperatures of your moss-covered areas at different times of day and in various weather conditions. Use an infrared thermometer for accurate LST readings. Compare these readings to your baseline and the control site.
Quantify the temperature differences you observe. For example, report that “the moss-covered wall maintained a surface temperature 15°F cooler than the adjacent bare concrete wall during peak afternoon sun.” Specific numbers are much more impactful than general statements.
Include photographic evidence showing the “before and after” state of your project site. Visual documentation provides powerful support to your temperature data. High-quality images can convey the transformation and the aesthetic improvements.
Beyond temperature, document other benefits like stormwater retention, improved air quality (if you have the means to measure it), and enhanced biodiversity. Even anecdotal observations of increased insect activity or bird visits can add value. A comprehensive report paints a fuller picture.
Share your findings with local government, community groups, and the public. Present your data in an accessible format, perhaps with simple graphs and clear summaries. This transparency builds trust and encourages broader adoption of similar `city temperature data moss` solutions.
By thoroughly documenting and reporting your project’s contribution, you not only celebrate your own success but also contribute to the growing body of knowledge about urban greening. Your efforts become a case study, inspiring others to tackle `heat island microclimate` challenges with natural solutions like moss. This makes your work a model for sustainable urban development.
Conclusion
Leveraging urban heat island data fundamentally transforms how we approach urban moss cultivation. It moves us from hopeful planting to strategic, data-driven interventions. This scientific approach ensures our greening efforts are not just aesthetically pleasing but also functionally effective in cooling our cities.
By understanding what `urban heat island map` data reveals, where to find it, and how to interpret different temperature measurements, you gain a powerful toolkit. This knowledge allows you to pinpoint high-priority sites and set realistic expectations for the cooling impact of your moss projects. It empowers you to make informed decisions.
Cross-referencing heat data with moisture and shade information further refines your site selection, ensuring that your moss installations thrive. Documenting and reporting your results provides concrete evidence of your contribution to combating the `heat island microclimate`. This accountability is key for showing impact.
Embrace the power of `urban heat island data moss projects` to make a tangible difference in your community. Your efforts contribute to cooler, greener, and more resilient urban environments for everyone. Start exploring your city’s climate data today and turn hot spots into cool, mossy havens.