You can run a moss tray experiment heat study on a kitchen counter and still learn something real about bryophytes. The trick is to treat it like a small classroom lab instead of a casual plant project.
Moss reacts fast to drying and temperature swings, which makes it perfect for simple home experiments. You will see changes in color, texture, and growth direction long before you would with most houseplants.
I like tray experiments because they force you to define a question and stick to it. If you keep your setup tight, your notes will tell you more than your memory ever will.
What You’re Testing: Heat, moisture, and surface conditions
Heat changes how quickly water leaves a tray, and moss lives or dies by that water film. Even when moss looks dry, it may still be metabolically active for short windows, so timing matters.
Moisture is the middleman between temperature and moss health in most indoor setups. A warmer tray often dries faster, and that can look like a heat effect when it is really a moisture effect.
Surface conditions decide where water sits and where it runs away. A rough, absorbent substrate holds a thin layer of moisture longer than a slick plastic surface.
For a clean moss tray experiment heat design, pick one surface type and keep it consistent across trays. If you change both heat and substrate at the same time, your results will be hard to interpret.
Heat can also change microbial activity, which can help or harm moss depending on what blooms in the tray. If you see algae taking over in the warm treatment, that is data, not a failure.
It helps to decide whether you are testing constant warmth or short heat pulses. A heat mat left on all day is a different stress pattern than a tray that warms up for two hours and then cools down.
In a home environment, heat is rarely isolated from humidity, so you should assume they are linked unless you control both. A warm tray under a loose lid can stay humid, while a warm tray in open air can dry brutally fast.
Moss does not have true roots, so it cannot chase water deeper into soil the way vascular plants do. That makes the top few millimeters of your substrate the real battleground in this experiment.
Surface texture also affects how moss anchors and spreads, which can change how it looks under stress. A tray that stays damp but offers poor grip may show curling and lifting that looks like heat damage.
Pay attention to where condensation forms, because it tells you where your microclimate is different. If the lid fogs on one side only, that side may be cooler and wetter even if the room feels uniform.
If you want to be extra clear, write your hypothesis as a single sentence before you start. A good example is, “At the same watering volume, a warmer tray will lose more mass per day and show lower condition scores.”
Materials List: Trays, substrates, and measurement tools
Use two to six shallow trays that are the same size, because geometry affects evaporation. Food storage trays, cafeteria trays, and seed starting trays all work if they are easy to clean.
Pick one substrate and commit to it for the full run. I get the most repeatable results with a thin layer of sifted pine bark fines mixed with a little washed sand.
For moss material, use one species or one mixed patch collected from the same spot. Mixing sidewalk moss with forest moss can add hidden differences in heat tolerance and water needs.
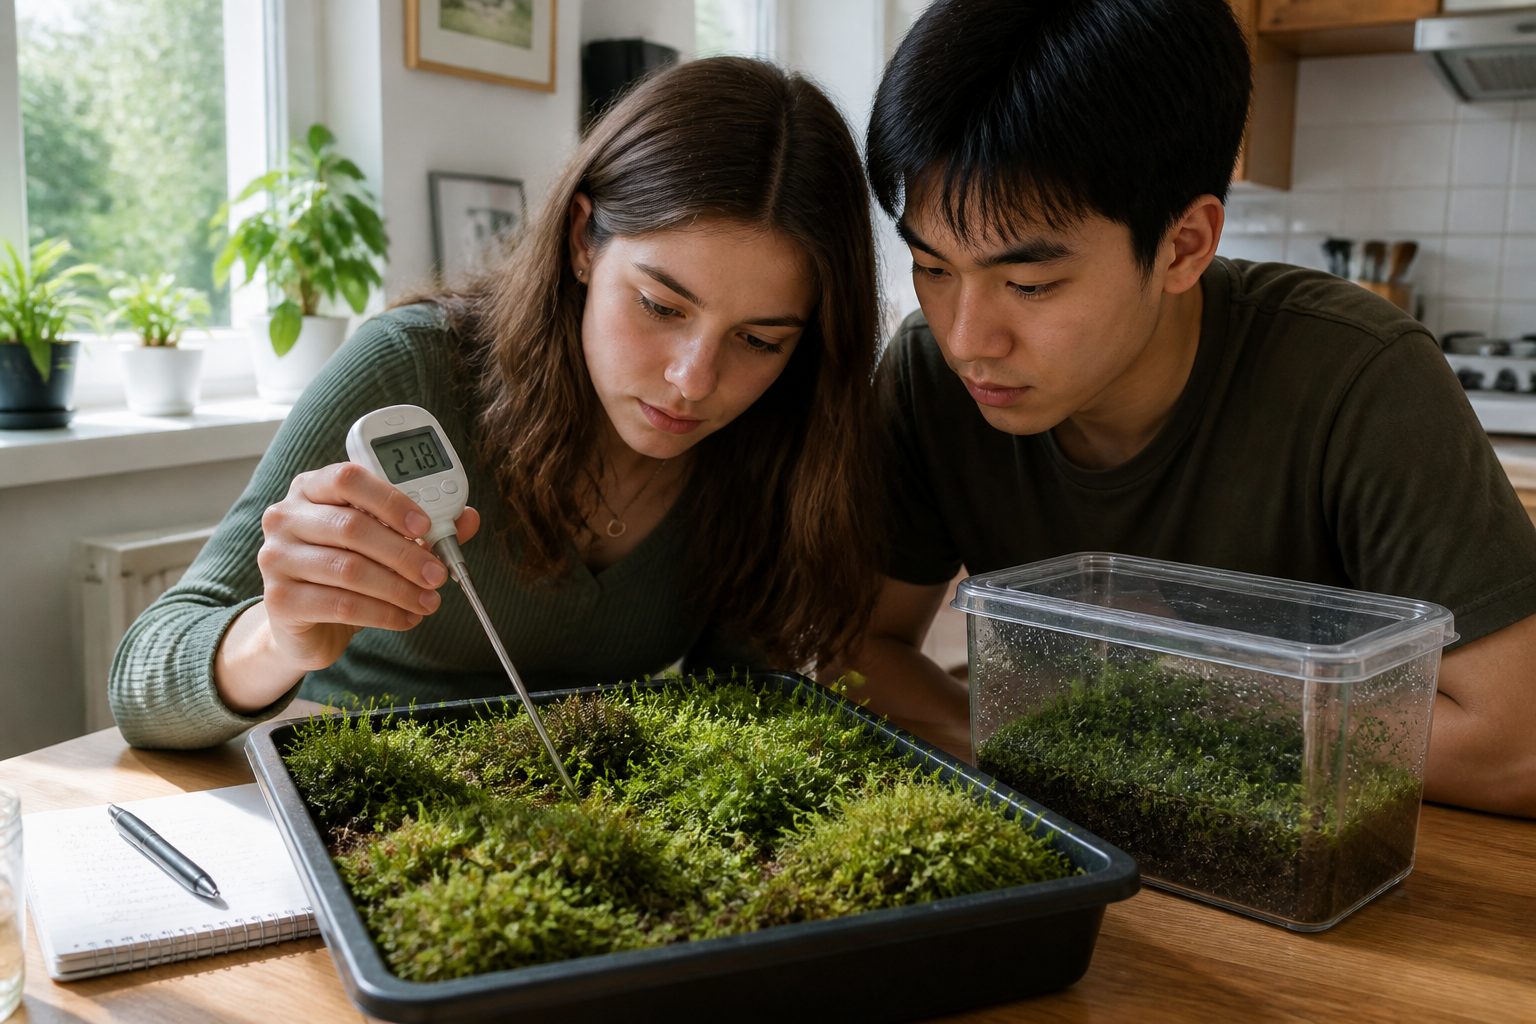
Measurement tools do not need to be fancy, but they do need to be consistent. A cheap digital kitchen scale, a basic thermometer, and a ruler can carry the whole experiment.
If you can swing it, add a simple sensor for data logging like a Bluetooth hygrometer or a USB temperature probe. Data logging helps you catch overnight drying spikes that your daytime checks miss.
Choose trays with enough rigidity that you can lift them without flexing and spilling water. A tray that bends in your hands makes daily weighing messy and adds random losses that look like evaporation.
Have a dedicated measuring cup or syringe that never changes mid-experiment. Switching spray bottles halfway through is a sneaky way to change droplet size and total volume without noticing.
A small soft brush or tweezers can help you place moss evenly without shredding it. Handling matters because crushed moss can brown from mechanical damage and confuse your heat results.
Use labels that survive moisture, like painter’s tape with permanent marker or plastic plant tags. If you rely on memory for which tray is which, you will mix them up at the worst possible time.
Distilled or dechlorinated water can reduce mineral crust and chlorine stress, especially in long runs. Tap water is still usable, but try to keep the water source consistent from day one to day fourteen.
If you use a heat mat, consider adding a thermostat controller so “low” and “medium” mean actual numbers. Without a controller, room temperature changes can shift mat output and blur your treatments.
A simple notebook is often better than an app for quick entries, because it keeps you from skipping notes. If you do use an app, make sure it exports to a format you can read later like CSV or plain text.
Setting Up Control and Treatment Trays
Your control group is the tray that gets normal room conditions with no added heat source. Your treatment tray gets the same everything except the heat input you want to test.
Keep the layout boring on purpose, because boring setups produce readable results. When you get tempted to add extra tweaks, write them down for the next round instead.
Start by adding the same substrate depth to every tray, and level it so water spreads similarly. Even a few millimeters of extra depth can change how long the surface stays damp after watering.
Place moss in patches that match in area and thickness as closely as you can. If you have one thick cushion and one thin sheet, split and mix them first so each tray gets a similar blend.
Decide whether you will press the moss into the substrate or just lay it on top, and do that consistently. Pressing increases contact and can make a tray look more resilient because it hydrates faster.
Let all trays sit for a short acclimation period before you start scoring, even if it is only 24 hours. That gives the moss time to recover from handling and reduces the “day one shock” effect.
Position the heat source so it warms the tray, not the air around it in an uneven way. A mat under one side of a tray can create a gradient that is interesting, but it is harder to interpret.
If you are using multiple treatments, randomize where they sit on the counter or shelf. Rotating tray positions every day can also help, but only if you rotate all trays in the same pattern.
Write down the exact start time and what “day zero” means for you. If you start watering at noon on day zero, do not compare it to a day when you watered at 7 a.m. and expect clean patterns.
| Tray | Heat condition | Notes to keep constant |
|---|---|---|
| Control A | No added heat, room temp | Same substrate depth, same moss area, same watering |
| Treatment B | Heat mat on low | Same light distance, same tray cover style, same airflow |
| Treatment C | Heat mat on medium | Same mist volume, same measurement schedule, same start time |
| Control D | No added heat, second control | Placed beside control A to check location effects |
A second control tray is not overkill in a home environment where microclimates are everywhere. If Control A and Control D drift apart, you have learned that placement is a variable you need to respect.
Keep a simple map of where each tray sits, especially if your counter is busy. A quick sketch prevents accidental swaps when you move things to cook dinner or clear space.
If you want to test heat without changing light, avoid putting heated trays closer to a window just because the outlet is there. Outlet convenience is one of the most common ways people sabotage their own controls.
Keeping Variables Steady: Light, airflow, and watering
Light drives drying, so you cannot treat it as background noise. Put every tray the same distance from the same window or the same grow light, and measure that distance with a ruler.
Airflow is a quiet troublemaker in home experiments. A tray near an HVAC vent can dry twice as fast as a tray across the room, even if both are the same temperature.
Watering needs to be measured, not guessed. I use a small syringe or a graduated spray bottle so each tray gets the same milliliters per day.
If you cover trays with clear lids or plastic wrap, do it for all trays and vent them the same way. A lid turns your tray into a mini humid chamber, and that can overpower your heat variable.
Keep your moss starting mass and coverage similar across trays. If one tray starts thicker, it will hold moisture longer and look more heat tolerant than it really is.
Try to keep the room routine steady during the run, including open windows and cooking steam. A single evening of boiling pasta near the trays can spike humidity and temporarily erase treatment differences.
If you use a grow light, keep the photoperiod fixed with a timer. A longer light period adds both energy and heat, and it can make your “heat mat effect” look bigger than it is.
Distance from the light matters more than most people expect, so measure from the bulb to the tray surface, not to the shelf. If you change bulbs or move the lamp, note it like a major event.
Airflow also includes small fans, ceiling fans, and even the draft you create when you walk past the trays. If you must use a fan, point it away and use it as a room mixer rather than a direct blower.
Water quality can act like a hidden variable when minerals build up on moss tips. If you notice white crust on the substrate, reduce concentration by switching to distilled water and noting the change.
Be consistent about when you water relative to when you measure mass. If you weigh after watering one day and before watering the next, your water-loss numbers will look chaotic for no biological reason.
Try to avoid “rescue watering” where you give extra water to the tray that looks worse. If you feel compelled to rescue it, record that you broke protocol and treat the run as a pilot study.
Even small differences in how you mist can matter, because some trays will get more runoff than others. Aim for a slow, even application that soaks the moss rather than blasting it sideways.
Data Collection Plan: What to measure and when
Pick a schedule you can keep, because missing days creates holes you cannot patch later. For a two week run, daily checks at the same time are better than random checks twice a day.
Start with three core measurements: tray temperature, tray mass, and visible moss condition. Tray mass is a simple proxy for water loss if you weigh the whole tray consistently.
Measure temperature at the moss surface, not across the room. An inexpensive infrared thermometer works, but even a probe thermometer taped to the tray surface is fine if you do it the same way each time.
Set a clear scoring system for moss condition so you do not rewrite history later. A five point scale based on color and turgor is simple, and it beats vague notes like “looks worse.”
If you want one extra metric, track how long the tray stays visibly damp after watering. That single number often explains most of what you see in a moss tray experiment heat setup.
Decide ahead of time whether you will weigh trays with lids on or lids off, and never switch midstream. A lid can hold droplets that add grams, and those grams will show up as fake “water retention.”
If your scale is sensitive, place a consistent platform like a cutting board on it before weighing. That keeps wet tray bottoms from slipping and reduces day-to-day wobble in the readings.
For moss condition scoring, define what each number means in plain language. A “5” might mean fully green and springy, while a “1” might mean mostly brown with brittle texture.
Include a short note about smell if you notice it, because sour or swampy odors can signal anaerobic conditions. That kind of tray problem can look like heat stress but is really a drainage and oxygen issue.
Track any visible new growth separately from stress signs, because they can overlap. A tray can show new green tips while older tissue browns, and you want your notes to capture both.
If you have time, add a weekly measurement of moss coverage using a simple grid photo. Even a rough estimate like “about 60% coverage” can show slow trends that daily notes miss.
Write down the room temperature once per day as a context variable. It is not your main measurement, but it helps you interpret why all trays changed together on a cold or hot day.
Make a plan for what you will do if a tray dries completely, because that will happen in some heat treatments. You can either keep watering on schedule to test recovery, or you can end the run and record it as a failure point.
How to Record Observations Clearly (Photos and Notes)
Photos are your best defense against wishful thinking. Take them from the same angle, at the same distance, with the same lighting, even if that means taping a mark on the floor.
Use a simple naming system so you can find images later. I label files with date, tray name, and time, like 2026-05-03ControlA0800.
Write notes like a lab log, not like a diary. Stick to what you can see and measure, and save interpretations for a separate line.
When you see something odd, write the context right away. A single note like “window open last night” can explain a sudden drying event better than any chart.
If you are using data logging sensors, export the data weekly so you do not lose it to a dead battery or an app update. Keep the raw file untouched and make a copy for analysis.
Include a reference object in your photos, like a small ruler or a coin, so scale stays obvious. Without a reference, it is hard to tell if a patch actually spread or if your camera just got closer.
Try to photograph before watering, because wet moss can look healthier than it is. A tray can appear bright green for ten minutes after misting and then fade back to dull color as it dries.
Use the same camera settings if you can, especially exposure and white balance. Auto settings can shift color between days and make normal variation look like a biological signal.
In your notes, separate “events” from “measurements” so you can scan later. An event might be “moved trays to clean counter,” while a measurement is “surface temp 82°F.”
If you see algae or mold, describe where it is and how fast it is spreading. A note like “thin green film in lower left corner” is more useful than “algae present.”
Record any maintenance you do, even if it feels minor, like wiping condensation off a lid. Small interventions can change humidity and light penetration in ways that matter.
At least once a week, write a short summary paragraph for each tray in your log. Weekly summaries help you see trends without rereading every daily line.
Basic Analysis: Averages, ranges, and simple charts
You do not need advanced stats to learn from this experiment, but you do need basic math. Calculate the average daily surface temperature for each tray and compare it to the control group.
Next, calculate daily water loss by subtracting today’s tray mass from yesterday’s tray mass. If the heated tray loses more grams per day, that is your first clue that moisture is driving outcomes.
Ranges matter because moss often responds to peaks, not averages. A tray that hits 90°F for two hours can behave differently than a tray that sits at 80°F all day.
Make one simple line chart with days on the x-axis and tray mass on the y-axis. Make a second chart for temperature, and keep them separate so each story stays readable.
If you scored moss condition, graph that score too, even if it feels subjective. When your score drops right after a temperature spike, you get a pattern you can argue with, not a hunch.
Calculate a simple weekly average as well as a daily average, because weekly averages smooth out noisy days. A single day with a forgotten lid can dominate a daily chart and hide the broader trend.
Look at the relationship between temperature and mass loss on the same day. If higher surface temperature consistently lines up with higher gram loss, your mechanism is probably evaporation-driven.
If you want a quick visual, make a scatter plot of temperature versus daily mass loss. Even without statistics, you can often see whether the points form a trend or just a cloud.
Do not ignore the first few days, but treat them carefully because the system is settling. Substrate moisture and moss hydration can start uneven and then stabilize as you get into a rhythm.
Note any step changes that happen right after you adjust something like venting or tray placement. A sudden shift is often a clue that your “constant variables” were not as constant as you thought.
When you compare trays, compare them by difference from control rather than raw values alone. Subtracting the control’s daily mass loss from the treatment’s daily mass loss can make patterns easier to see.
If you ran replicates, calculate the average and the spread across replicates for each condition. A condition that looks strong in one tray but weak in two others is telling you the effect is not stable.
Keep your charts simple enough that you will actually look at them more than once. The goal is to see what happened, not to create a complicated dashboard you never revisit.
Interpreting Outcomes: What your results do and don’t prove
If the heated tray looks worse, you have not proven that heat directly harmed the moss. You have shown that your heat treatment, as implemented, produced conditions that reduced moss performance.
That distinction matters because most home heat setups mainly change drying rate. When moss browns in the warm tray, the real cause may be shorter hydration time between waterings.
If the heated tray looks better, be skeptical in a healthy way. A gentle heat source can keep water from staying cold and stagnant, and that can reduce fungal issues in some trays.
Watch for confounders like algae, mold, or fungus gnats, because they can swamp your moss response. If one tray grows a green slime layer, your moss condition score may reflect competition more than temperature.
Your experiment also does not prove results will transfer outdoors. Urban moss installations deal with rain pulses, wind, sun angles, and nighttime radiative cooling that your indoor trays do not mimic.
Try to interpret “browning” carefully, because moss can brown from dehydration and then recover when rehydrated. If you see rapid greening after watering, that suggests stress rather than permanent tissue death.
Texture changes are often as informative as color changes. Crispy, brittle moss usually indicates longer dry periods, while mushy texture can indicate overwatering or microbial breakdown.
If your warm tray stays greener but shows less spread, you may be seeing a tradeoff between survival and growth. Moss can maintain basic function under mild stress while pausing expansion.
Be honest about the limits of your identification if you are not sure what species you have. Different mosses have different strategies, and a mixed tray can hide that by averaging everything together.
Consider whether the heat source created a bottom-up warming that is unlike natural sun heating. In the real world, moss often heats from the top, which can create different drying patterns than a heat mat.
If your controls performed poorly too, your baseline conditions may be too harsh or too wet for that moss. A failed control is not useless, but it means you tested “bad conditions plus heat” rather than heat alone.
When you write your conclusion, use cautious language that matches what you actually did. “In my indoor tray setup, added heat increased drying rate and reduced condition scores” is stronger than “heat kills moss.”
Also consider the possibility that your heat treatment changed your watering behavior without you noticing. People tend to water the tray that looks worse more carefully, and that can blur differences in either direction.
Improving the Experiment: Replicates and longer timeframes
Replication is where home experiments stop being cute and start being convincing. If you can run three control trays and three heated trays, random quirks cancel out and patterns get louder.
Replicates also protect you from one bad tray ruining your week. A spilled tray, a forgotten watering, or a mold outbreak becomes a data point, not a total loss.
Extend your timeframe if you want to see growth instead of just stress response. Two weeks shows drying damage, but six to eight weeks can show whether moss actually spreads or thickens.
If you change your design for a second run, change one thing at a time. For example, keep heat levels the same and test a different watering schedule, because you will learn faster that way.
Keep using data logging if you can, because longer runs create more chances to forget what happened. A simple temperature and humidity trace can explain why week five went sideways.
If you want more resolution, add intermediate heat levels rather than jumping from no heat to medium heat. A low, medium, and high gradient can reveal a threshold where moss performance drops sharply.
Consider running the same experiment in two seasons if your home climate changes a lot. Winter indoor air can be much drier than summer indoor air, and that background dryness can change your results.
Try a “recovery phase” at the end where you remove heat and keep watering consistent for a week. Recovery behavior can tell you whether the moss was stressed or actually damaged beyond repair.
Another improvement is to standardize moss pieces by cutting them into similar sized plugs. Plugs reduce the chance that one tray gets all the thick, healthy material by accident.
If algae is a recurring issue, you can reduce nutrients and light intensity rather than blaming heat. A cleaner substrate and slightly lower light can keep algae from becoming the dominant organism in the tray.
Longer timeframes also mean you should plan for maintenance events like cleaning lids or checking for pests. Treat maintenance like a scheduled procedure so it does not become an uncontrolled variable.
If you want to get more rigorous, pre-register your plan in your notebook before you start. Writing “I will run 14 days, water 10 mL daily, and score at 8 a.m.” keeps you honest when results get messy.
When you repeat the experiment, keep your old data and compare runs side by side. Repeatability across runs is one of the strongest signals that you are seeing a real effect.
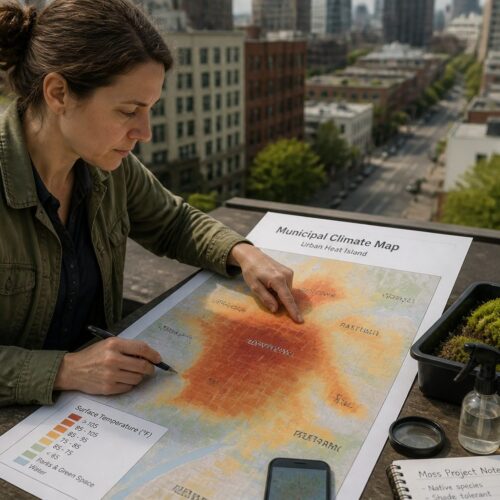
Applying Findings to Real Urban Moss Installations
Urban moss projects fail most often from drying, not from cold. If your moss tray experiment heat results show rapid mass loss under warmth, treat that as a warning about summer walls and rooftops.
Translate tray lessons into design choices like shading, irrigation timing, and substrate texture. A rough, water holding surface can buy moss extra hours of hydration on a hot day.
If your warm trays did fine when you watered more often, that points to scheduling rather than species choice. In cities, early morning misting can beat afternoon misting because it reduces evaporation losses.
Use your control group outcomes to set a baseline for what “normal” looks like in your home climate. That baseline helps you judge whether a proposed installation site is harsh or manageable.
Replication matters here too, because a single tray can mislead you into overconfidence. When multiple replicates agree, you can make bolder decisions about where to mount moss panels and how to maintain them.
Think about heat sources in cities that mimic your heat mat, like warm masonry, metal flashing, and dark painted surfaces. A wall that stores heat into the evening can keep moss dry longer than you expect.
Your tray substrate is a stand-in for whatever you plan to mount moss on, so take its behavior seriously. If your substrate sheds water quickly, a real installation on smooth concrete may need a textured backing layer.
Use your measured “time to dry” as a planning number for irrigation frequency. If the tray dries in four hours under warmth, a once-a-day mist schedule may be fine in spring and useless in summer.
Heat also interacts with wind, and urban wind can be stronger than indoor airflow by an order of magnitude. If a mild indoor heat treatment caused stress, assume a sunny, windy balcony will be harsher.
If your experiment showed that lids or humidity chambers dramatically improved condition, translate that into real-world sheltering. Overhangs, recessed mounting, and partial shade can act like a “lid” without sealing the system.
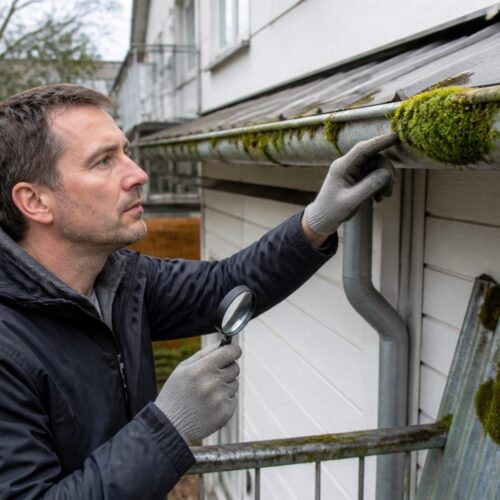
Use your photo record to train your eye for early warning signs. In installations, catching dulling color and curling tips early is the difference between a quick adjustment and a full replacement.
Remember that urban installations often face water quality issues like hard water and runoff minerals. If you saw mineral crust indoors, plan for filtration or rainwater collection outdoors.
Finally, treat your tray results as a decision tool, not a guarantee. The point is to reduce risk by understanding which conditions your moss tolerates and which conditions push it past recovery.
Conclusion
A good moss tray experiment heat setup is simple, but it demands discipline about variables and notes. If you keep your method steady, the moss will give you clear signals fast.
Your charts and photos will not answer every question, but they will narrow the list of plausible causes. That is the point of a home experiment, to trade guesses for evidence you can inspect.
Once you have one solid run, run it again with replication and a slightly longer timeline. You will trust your conclusions more when the pattern repeats under the same rules.
When you finish, write a short “what I would do differently” section for yourself while the details are fresh. That habit turns one experiment into a personal protocol you can reuse and improve.
Even if your results are messy, you will still come away with practical numbers about drying rate and hydration time. Those numbers are exactly what you need to make moss care less mysterious and more predictable.
- Pick one heat level and stick with it
- Use a clear control group placement
- Weigh trays daily for water loss
- Log surface temperature at the moss
- Photograph from a fixed angle
- Run at least three replicates per condition